SSD vs HDD: A Comprehensive Comparison (2025 Update)

An SSD (Solid State Drive) is a storage device that uses semiconductor flash memory (NAND Flash) as its storage medium. Unlike traditional Hard Disk Drives (HDDs), SSDs store data using semiconductors and are implemented through purely electronic circuits without any mechanical components. This fundamental difference results in significant distinctions from HDDs in terms of performance, power consumption, and reliability. While the concept of SSDs has existed for quite some time, their emergence as mainstream storage devices is a phenomenon of only the past decade or so. In early 2008, only a handful of companies were developing SSDs; today, hundreds of companies of all sizes are involved in the industry. In both consumer and enterprise markets, SSDs have shaken the very foundation of the two HDD giants—Western Digital (WD for short) and Seagate—and are replacing HDDs as the dominant storage devices.
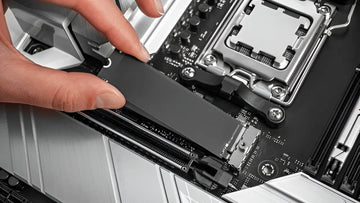
Traditional HDDs employ a mechanical structure consisting of "read/write heads + motor + magnetic platters," while SSDs utilize a semiconductor storage chip structure comprising "flash memory medium + controller." These two technologies feature entirely different data storage media and read/write mechanisms, as shown in Table 1-1. Their physical structures also differ significantly, as illustrated in Figure 1-1.
Table 1-1 Structural Comparison between HDD and SSD
| HDD | SSD | |
| Type | Mechanical | Electronic |
| Data Storage Medium | Magnetic disk (magnetic medium) | Flash memory |
| Read/Write | Read/write head + motor (seeking) | Controller |

From a technical specification standpoint, SSDs offer the following advantages over HDDs:
1. Superior Performance
Undoubtedly, in terms of speed—whether measured by user experience or benchmark data—SSDs far surpass HDDs. Table 1-2 presents a comparison between one SSD model and one HDD model, revealing performance differences ranging from several times to several hundred times, with random read/write performance (speed and latency) showing the most dramatic disparity.
Table 1-2 Performance Comparison between HDD and SSD
| SATA SSD (500GB) | SATA HDD (500GB, 7,200rpm) | Difference | |
| Medium | Flash memory | Magnetic disk | - |
| Sequential Read/Write (MB/s) | 540/330* | 160/60 | 3×/6× |
| Random Read/Write (IOPS) | 98,000/70,000 | 450/400 | 217×/175× |
| Data Access Time (ms) | 0.1 | 10-12 | 100-120× |
| Performance Score (based on PCMark) | 78,700 | 5,600 | 14× |
*The first value represents read speed, and the second represents write speed. The same applies throughout.
Performance testing tools are divided into two categories: sequential read/write throughput tools and random read/write IOPS tools, including but not limited to IOMeter and FIO. There are also user-experience-oriented performance testing tools such as PCMark Vantage, which evaluates application runtime and loading times. Performance test items generally focus on factors that impact user experience, including system boot time, file loading time, and file editing operations. As shown in Figure 1-2, HDD scores pale in comparison to those of SSDs.
Learn more about Oscoo ON900 SSD.

2. Low Power Consumption
HDDs typically consume 6-8W during operation, while SATA SSDs consume approximately 5W, with standby power consumption dropping to the milliwatt (mW) level.
The industry defines several power consumption categories: Peak Power, Active Power (read/write), Idle Power, and power-saving modes (which activate sleep modes and shut down as many non-working hardware modules as possible, professionally defined as Standby/Sleep Power and DevSleep Power). DevSleep Power, in particular, can be reduced to below 10mW, making it suitable for demanding energy-efficiency scenarios such as consumer laptops in hibernation mode (where extremely low SSD power consumption is critical). Table 1-3 compares the power consumption of HDDs and SSDs.
Table 1-3 Power Consumption Comparison between HDD and SSD
| HDD | SATA SSD | PCIe SSD | |
| Peak Power (W) | 8 | 6 | 25 |
| Active Power (Read/Write) (W) | 6 | 5 | 15 |
| Sleep Power (mW) | 500 | 100 | 200 |
| Deep Sleep Power (DevSleep) (mW) | Not Supported | 5 | 10 |
Analysis of SSD power consumption reveals that read/write power is primarily consumed by the flash memory. Since data read and write operations occur concurrently in the backend flash memory, the unit read/write power consumption of the flash is most critical—for instance, the read/write power consumption of a 16KB flash page determines the average read/write power consumption of the SSD under full host load.
Additionally, the controller affects read/write power consumption, accounting for approximately 20% of total power consumption. Factors such as the ASIC controller CPU frequency and count, the number of backend channels, the number of data ECC encoders/decoders, and design considerations all influence the controller's overall power consumption.
The scientific method for comparing power consumption should be power/IOPS—that is, comparing the power output per unit of IOPS, where lower values are better. Due to SSDs' extremely high performance, the performance generated per unit of power is hundreds of times that of HDDs, which is why SSDs are considered high-performance, low-power, energy-efficient products suitable for data center applications.
3. Shock and Drop Resistance
SSDs contain no mechanical components internally, making them more shock-resistant than HDDs. HDDs feature mechanical structures where the read/write heads and platters can suffer physical damage from contact and collision during drops, with no possibility of recovery. SSDs, with their electronic and PCB structure, do not suffer mechanical damage during drops, making them more shock-resistant and reliable. Furthermore, SSDs are less demanding regarding environmental conditions than HDDs, making them better suited as storage devices for portable notebooks and tablets. From a reliability perspective, SSDs have a lower probability of physical damage resulting in data loss compared to HDDs.
4. Silent Operation
Due to the absence of high-speed motor rotation in their structure, SSDs operate silently.
5. Compact and Versatile Form Factors
HDDs are generally available only in 3.5-inch and 2.5-inch form factors. SSDs offer these sizes as well as smaller formats such as M.2, which can be mounted directly on motherboards, and can even be reduced to chip-level sizes—for example, BGA SSDs measure only 16mm × 30mm.
Finally, let's provide a comprehensive comparison of SSDs and HDDs, as shown in Table 1-4.
Table 1-4 HDD vs SSD Comparison Matrix
| SSD | HDD | SSD | HDD | ||
| Capacity | ✓ | Noise | ✓ | ||
| Performance | ✓ | Weight | ✓ | ||
| Reliability | ✓ | Shock Resistance | ✓ | ||
| Lifespan | ✓ | Temperature Tolerance | ✓ | ||
| Form Factor/Size | ✓ | Price | ✓ | ||
| Power Consumption | ✓ |
*Note: Checkmarks (✓) indicate superior performance in that category.
The table above demonstrates that SSDs comprehensively outperform HDDs across all metrics. Combined with the continuous price reductions of SSDs in recent years, mainstream storage component SSDs replacing HDDs has become a reality.